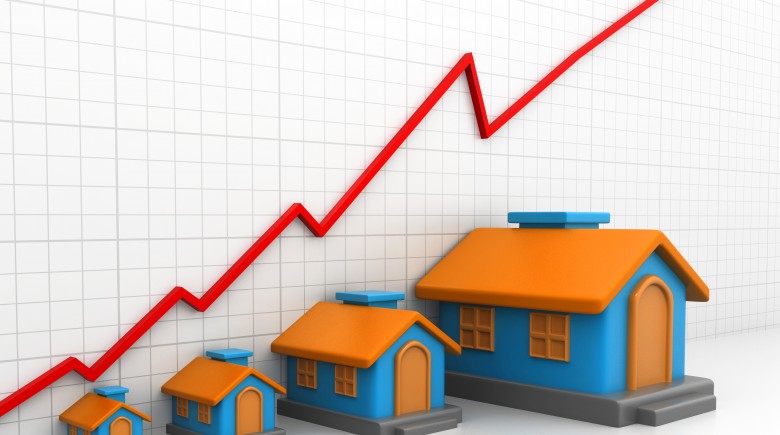
The S&P/Case-Shiller Home Price Index shows that home prices climbed 10.9 percent higher than the same period in 2012. The three indices, which measure housing pricing for sales activities that occurred in the months of January, February and March. Numbers for March represents the most annual gain since April 2006—home prices peaked around July 2006. In February, the measurement was revised to 9.4 percent from the original report of 9.3 percent.
The Bloomberg survey of 30 economists returned estimates ranging from increases of 9.3 percent to 10.6 percent and a median advance of a 10.2 percent.
Home price index details
The home price indicator is comprised of a series of three indexes– 10-City and 20-City composites and a national composite. The indicator gauges changes in the total value of all existing single-family homes in the U.S. The S&P/Case-Shiller 20-City Composite Home Price Index component of the index series measures the value of residential real estate in 20 metropolitan areas around the country.
It increased a seasonally-adjusted 1.1 percent in March—exceeding the 1 percent gain predicted by some economists. The gain also surpasses the 10.2 percent forecasted for year-over-year changes.
Each of the 20 metropolitan regions has registered an annual gain for three consecutive months. In March, average home prices climbed back to late 2003 levels.
Here are the five cities with the best yearly gains:
- Phoenix – 22.5%
- San Francisco – 22.2%
- Las Vegas – 20.6
- Atlanta – 19.1%
- Detroit – 18.5%
The following five metropolitan areas recorded the smallest gains: New York (2.6%), Cleveland (4.8%), Boston (6.7%), Dallas (6.8%) and Charlotte (7.3%).
In the first quarter (Q1) of 2013, the National Index increased 1.2 percent over the fourth quarter 2012. It soared 10.2 percent higher than Q1 in 2012. The 10-City Composite Index showed a 10.3 percent increase in home prices on a yearly basis.
Reasons for home price appreciation
Consumer confidence and record-low interest rates for home loans (averaging 3.59 percent in the week ending May 23,) have combined to create more buyer demand for both existing homes and new houses. Add to the mix a third component—the lowest inventory of houses on the market in nearly ten years— and you have a sellers’ market in certain pockets across the nation.
As home owners regain more of the home equity they lost after the collapse of home prices—declining an average of 34 percent over five years—the increase wealth could provide needed support for builders and overall consumer demand.
Brian Jones, senior U.S., a economist at the New York location for Societe Generale, said “We have a continued, gradual recovery.” Jones made the highest prediction of the economists responding to the Bloomberg poll—a 10.6 percent increased. “The data is solid,” said Jones.
In a statement released by David Blitzer, chairman of the S&P index committee, he refers to the series of good news that verify the ”strong trends” in the housing market. However, Blitzer warned that “… the larger than usual share of multifamily housing, a large number of homes still in some stage of foreclosure and buying-to-rent by investors suggest that the housing recovery is not complete.”


)