Credit card default has taken an interesting turn since the recession ended in June 2009 and the recovery began. Credit card issuers have different standards almost per customer for defaults (usually somewhere between 60-90 days delinquent) and availability of data. As a result, it makes more sense to focus on the definitive default category – chargeoffs. A good chart to look at the raw numbers for both delinquencies and chargeoffs can be found at the Federal Reserve website.
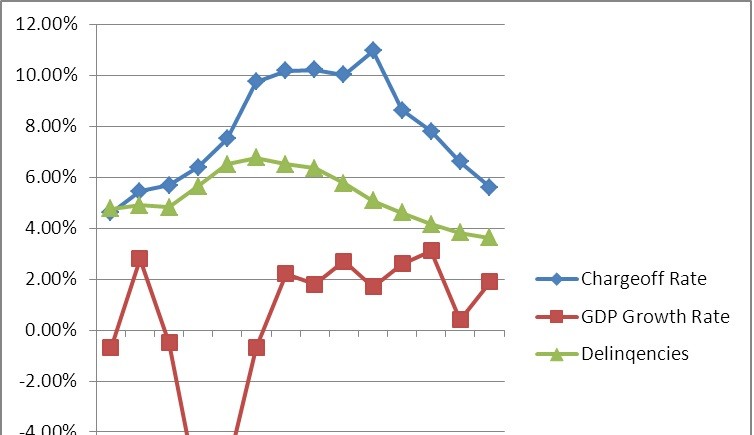
In a general sense, chargeoff rates of credit card default rose from 2008 to 2010 and then had a sharp decline from 2010 until the present. Delinquencies – here shown to be 30 days or more past due and still accruing interest – show a similar curve, but not as extreme. For comparison purposes, the GDP growth rate is included, showing the increase in delinquencies and chargeoffs as the economy contracts.
The pattern actually has an interesting correlation with several other economic factors, such as GDP growth. As GDP grows, delinquencies tend to decrease afterward, and as GDP shrinks, delinquencies rise. Currently GDP is seeing some modest growth with delinquencies decreasing, and banks are also cutting back on their lending which is also leading to decreased delinquencies and credit card default simply through fewer credit cards in use.
Delinquencies: http://www.federalreserve.gov/releases/chargeoff/delallsa.htm
Chargeoffs: http://www.federalreserve.gov/releases/chargeoff/chgallsa.htm


 and availability of data. As a result, it makes more sense to focus on' ,'https://betterfinancepath.com/wp-content/uploads/2011/10/original1.jpg'))