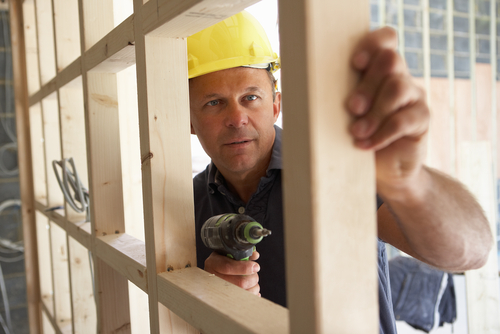
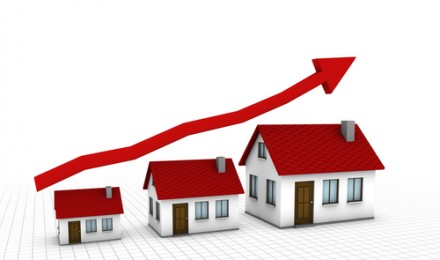
December marks the eight straight month of improve confidence based on the latest report by the National Association of Home Builders. The NAHB’s report also shows that the NAHB/Wells Fargo Housing Market Index climbed to its highest level since April 2006 to 47 compared to November’s revised figure of 45. Although the number represents a six year high, it includes a weaker showing in the western and southern regions of the country.
Builders’ Confidence
According to the NAHB release, homebuilders are in the midst of some of the strongest building activity experience in “more than five years.” Buyer foot traffic has returned to the developments – and they are serious. According to NAHB Chairman Barry Rutenberg, who is also a Gainesville, the decline in vacant homes and foreclosures has contributed to vastly improved marketplace.
Rutenberg believes the difficulty families have qualifying for home mortgages continues to “holding back potential home sales.” Nonetheless, he sees the “consistent upward trend” in the confidence of U.S. homebuilders as a cornerstone of a long awaited housing recovery. The NAHB’s Chief Economist David Crowe states that he foresees the recovery continuing into next year.
The NAHB/Wells Fargo Housing Market Index
The NAHB/Wells Fargo Housing Market Index consists of a monthly survey that tracks the perception of home builders across the country. The survey focuses on the construction on single-family homes and builders’ sales expectations for the next six months.
Builders must rate their expectations as “good,” fair”or “poor”. The poll also asks the respondents to rate the quality of buyers’ foot traffic in the following manner: as “high to very high,” “average” or “low to very low.” The combined scores of the two components are used to calculate a seasonally adjusted housing index. A number above 50 shows that shows more builders view the sales environment as good rather than poor.
According the NAHB release, two of three components of the index have moved above the critical 50 benchmark or midpoint. In December, the component that measures the current sales expectation indicator increases two points to 51. The HMI component that tracks builders’ sales expectations for the next six months, decreased by one point—falling to 51. The third component, which gauge the traffic of potential home buyers rose one point to 36.


)